Last month I wrote about the Q1 post-mortem that nobody runs. The one that looks past pipeline and rep performance and asks whether the plan itself was structurally sound.
That newsletter was the framework, this one is the data behind it.
We just published The Annual Plan Reality Check, a study of 403 revenue plans from B2B SaaS companies with 30 to 300 quota-carrying reps, built between 2022 and 2025. We scored each plan on four structural attributes on the day it was deployed, then matched those scores against year-end attainment.
The headline finding: the strongest plans hit 91% of quota, while the weakest hit 49%. A 43-point gap, visible on deploy day, before a single sales rep touched a single opportunity. That number is striking, but it's not the finding that keeps me up at night, it's this one:
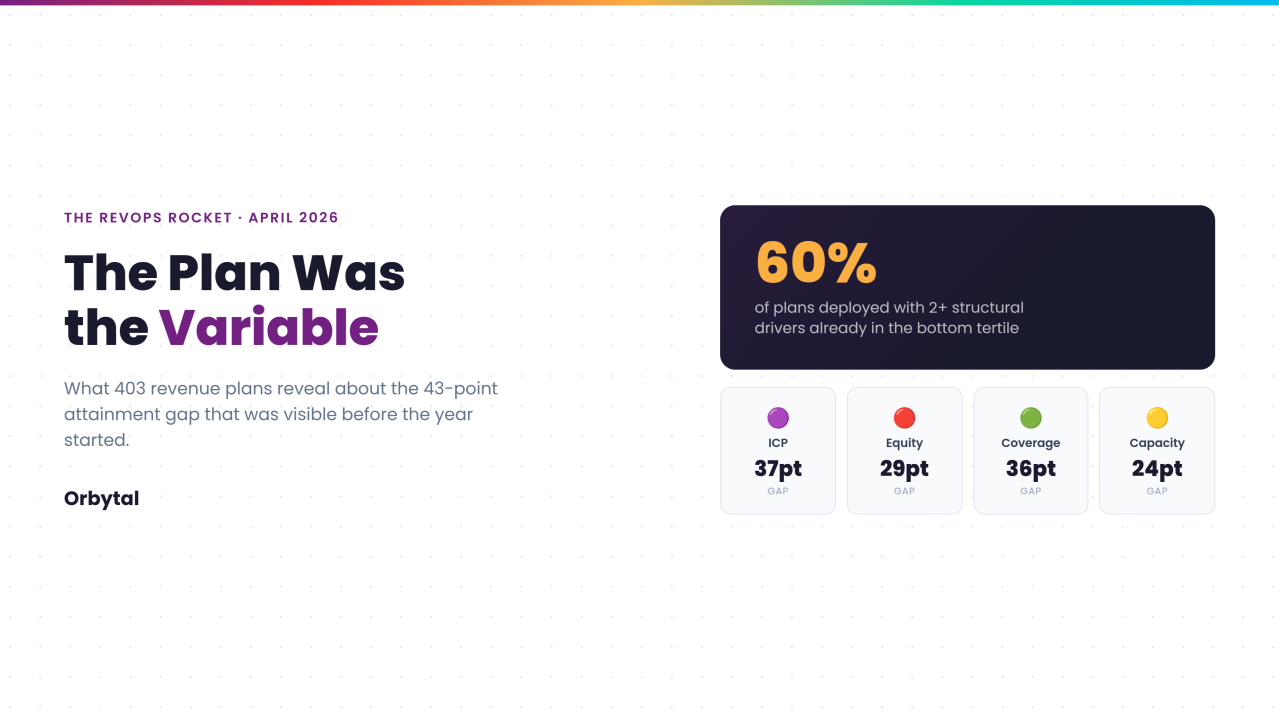
60% of the plans in the dataset deployed with two or more structural drivers already in the bottom tertile. On the day they launched, the majority of revenue plans were already on the wrong side of the attainment cliff.
And the cliff is real. Plans with zero weak drivers averaged 91% attainment. Plans with two weak drivers dropped to 59%. By three, it was 49%. By four, 42%. The failures don't add. They compound.
What We Measured
Every plan was scored on four things, all of which are measurable before January 1st.
ICP Coherence
What percentage of named accounts actually matched the ICP definition active on deploy day? This turned out to be the single strongest predictor of attainment. Top-tertile plans delivered 86% attainment. Bottom-tertile: 49%. A 37-point spread, and the widest gap of any driver.
Territory Equity
How fairly was TAM-weighted opportunity distributed across territories? Top tertile: 84%. Bottom: 55%. A 29-point gap. Most teams measure territory fairness by account count. The data says that's the wrong denominator.
Coverage Adequacy
What percentage of territories had at least 3x planned pipeline coverage at deploy? Top: 87%. Bottom: 51%. The coverage math on January 2nd predicted the attainment reality in November.
Capacity Realism
How much quota was assigned to reps who hadn't been hired yet, or hadn't been in seat long enough to be productive? Top: 80%. Bottom: 56%. This is the most recoverable driver mid-year, and it still carried a 24-point gap when it went unaddressed.
The Driver That Surprised Us
I expected territory equity to be the strongest predictor. It's the one everyone talks about, the one that drives the most visible rep frustration, and the one I've spent the most time fixing across 400+ plans.
But....ICP Coherence won, and it wasn't close. Knowing nothing else about a plan except how well its named accounts matched the company's actual ICP would let you predict year-end attainment with meaningful accuracy.
The implication is direct: if your team only has bandwidth to audit one thing before the plan deploys, audit ICP coherence first. Are the accounts your reps are actually working the accounts your scoring model says they should be working? Most teams have never asked that question against their own definition.
The Five-Question Self-Audit
You don't need our platform to run this diagnostic. You need your CRM data, an honest 30 minutes, and a willingness to look at what you find.
1. Equity: Calculate the Gini coefficient on TAM-weighted opportunity across your territories. Does it look balanced, or do your top territories quietly own 40% of the opportunity?
2. Coverage: What percentage of your territories deployed with at least 3x planned pipeline coverage? Below 70% means you're depending on conversion rate improvements that haven't been earned.
3. ICP fit: Of the named accounts your reps are working today, what percentage score above your ICP threshold? Run the filter. The number is almost always lower than leadership assumes.
4. Phantom capacity: How much of your annual quota depends on reps not yet hired, or reps with fewer than five months of tenure?
5. The compounding test: On how many of the four above do you fall in the bottom third? Two or more is the threshold where the data shows attainment falling off a cliff.
We built a 13-question version of this diagnostic based on the same four drivers. It takes less than five minutes, it's not gated, and it gives you a Structural Soundness Score that tells you which driver to fix first.
Take the Plan Reality Check: orbytal.ai/plan-reality-check
What This Changes
The revenue leadership conversation for the last decade has been almost entirely about execution: better coaching, better forecasting, better pipeline management, better tools for the reps. Of course all of that still matters, but the data from more than 400 live, measured sales orgs suggests the largest attainable lever isn't in execution at all. It's in how the plan is built before anyone starts executing against it.
That reframe changes where the diagnostic attention goes. Not after the quarter misses, but before the year starts. Not at the pipeline level, but at the structural level. And honestly, not with new technology, but with the discipline to ask five questions of the plan before it goes live.
The full research is published at orbytal.ai/research/annual-plan-reality-check. I'd rather you read it and tell me where I'm wrong than agree with it uncritically. The methodology is transparent, the limitations are disclosed, and the data is real. Pick it apart.